TabXEval

Tabular eXhaustive and eXplainable Evaluation

A rubric-driven framework for evaluating generated tables through structural alignment, semantic comparison, and interpretable discrepancy analysis.

Why It Matters

Evaluation needs more than string overlap

Traditional metrics often miss structural errors, schema shifts, and subtle content discrepancies in generated tables.

How It Works

Two-phase alignment and comparison

TabAlign handles structural alignment first, then TabCompare performs semantic and syntactic comparison under a detailed rubric.

What We Built

A benchmark for realistic table perturbations

TabXBench supports controlled evaluation with multi-domain tables and human-annotated judgments.

Highlights

  • Exhaustive rubric: combines structural descriptors with contextual quantification for comprehensive table comparison.
  • Explainable evaluation: separates structural alignment from semantic comparison to reveal where systems diverge.
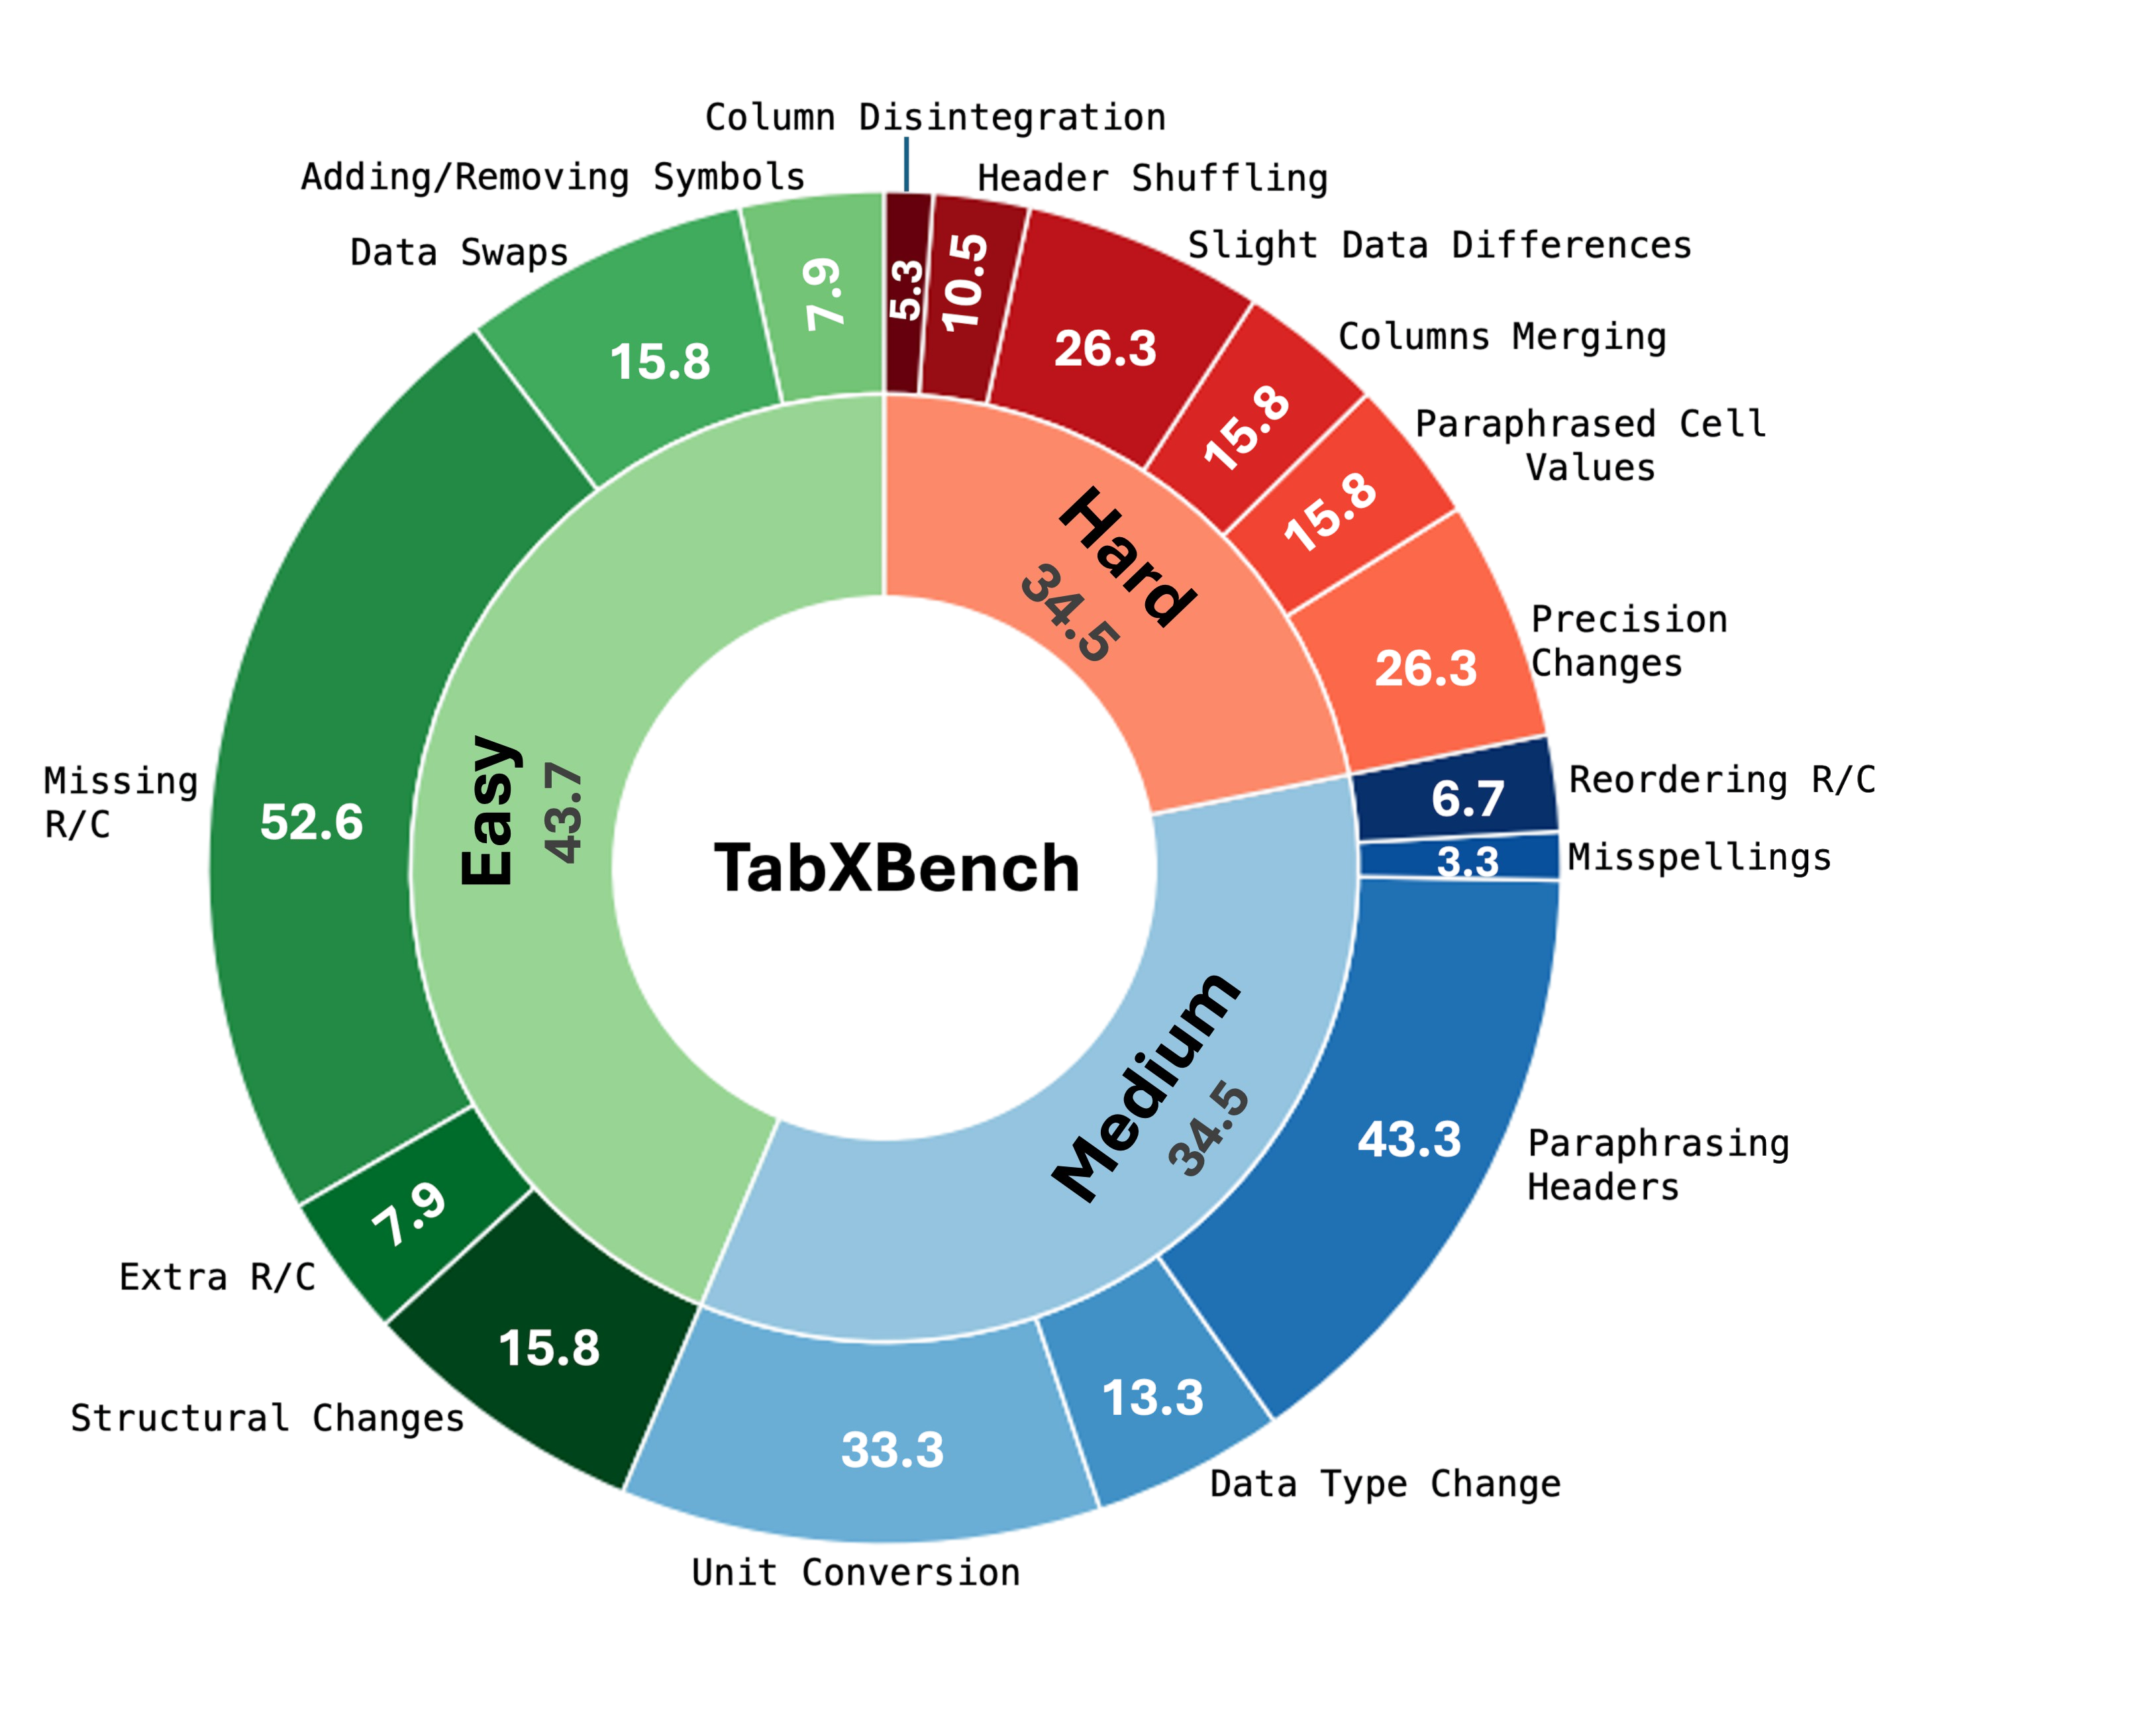
  • Benchmark-backed analysis: TabXBench captures realistic perturbations across domains for robust metric study.
  • Human alignment: results show stronger qualitative and quantitative agreement with human judgments than conventional baselines.
2 Core Phases
Explainable Evaluation Traces
Multi-domain Benchmark Coverage
Human Judgment Alignment

System Overview

From table alignment to interpretable scoring

TabXEval turns table evaluation into a structured, rubric-aware process rather than a single opaque matching score.

  • TabAlign: align reference and candidate tables structurally before comparison.
  • TabCompare: inspect semantic and syntactic consistency at fine granularity.
  • Explainability: expose discrepancies clearly enough for qualitative analysis and diagnosis.
TabXEval framework overview

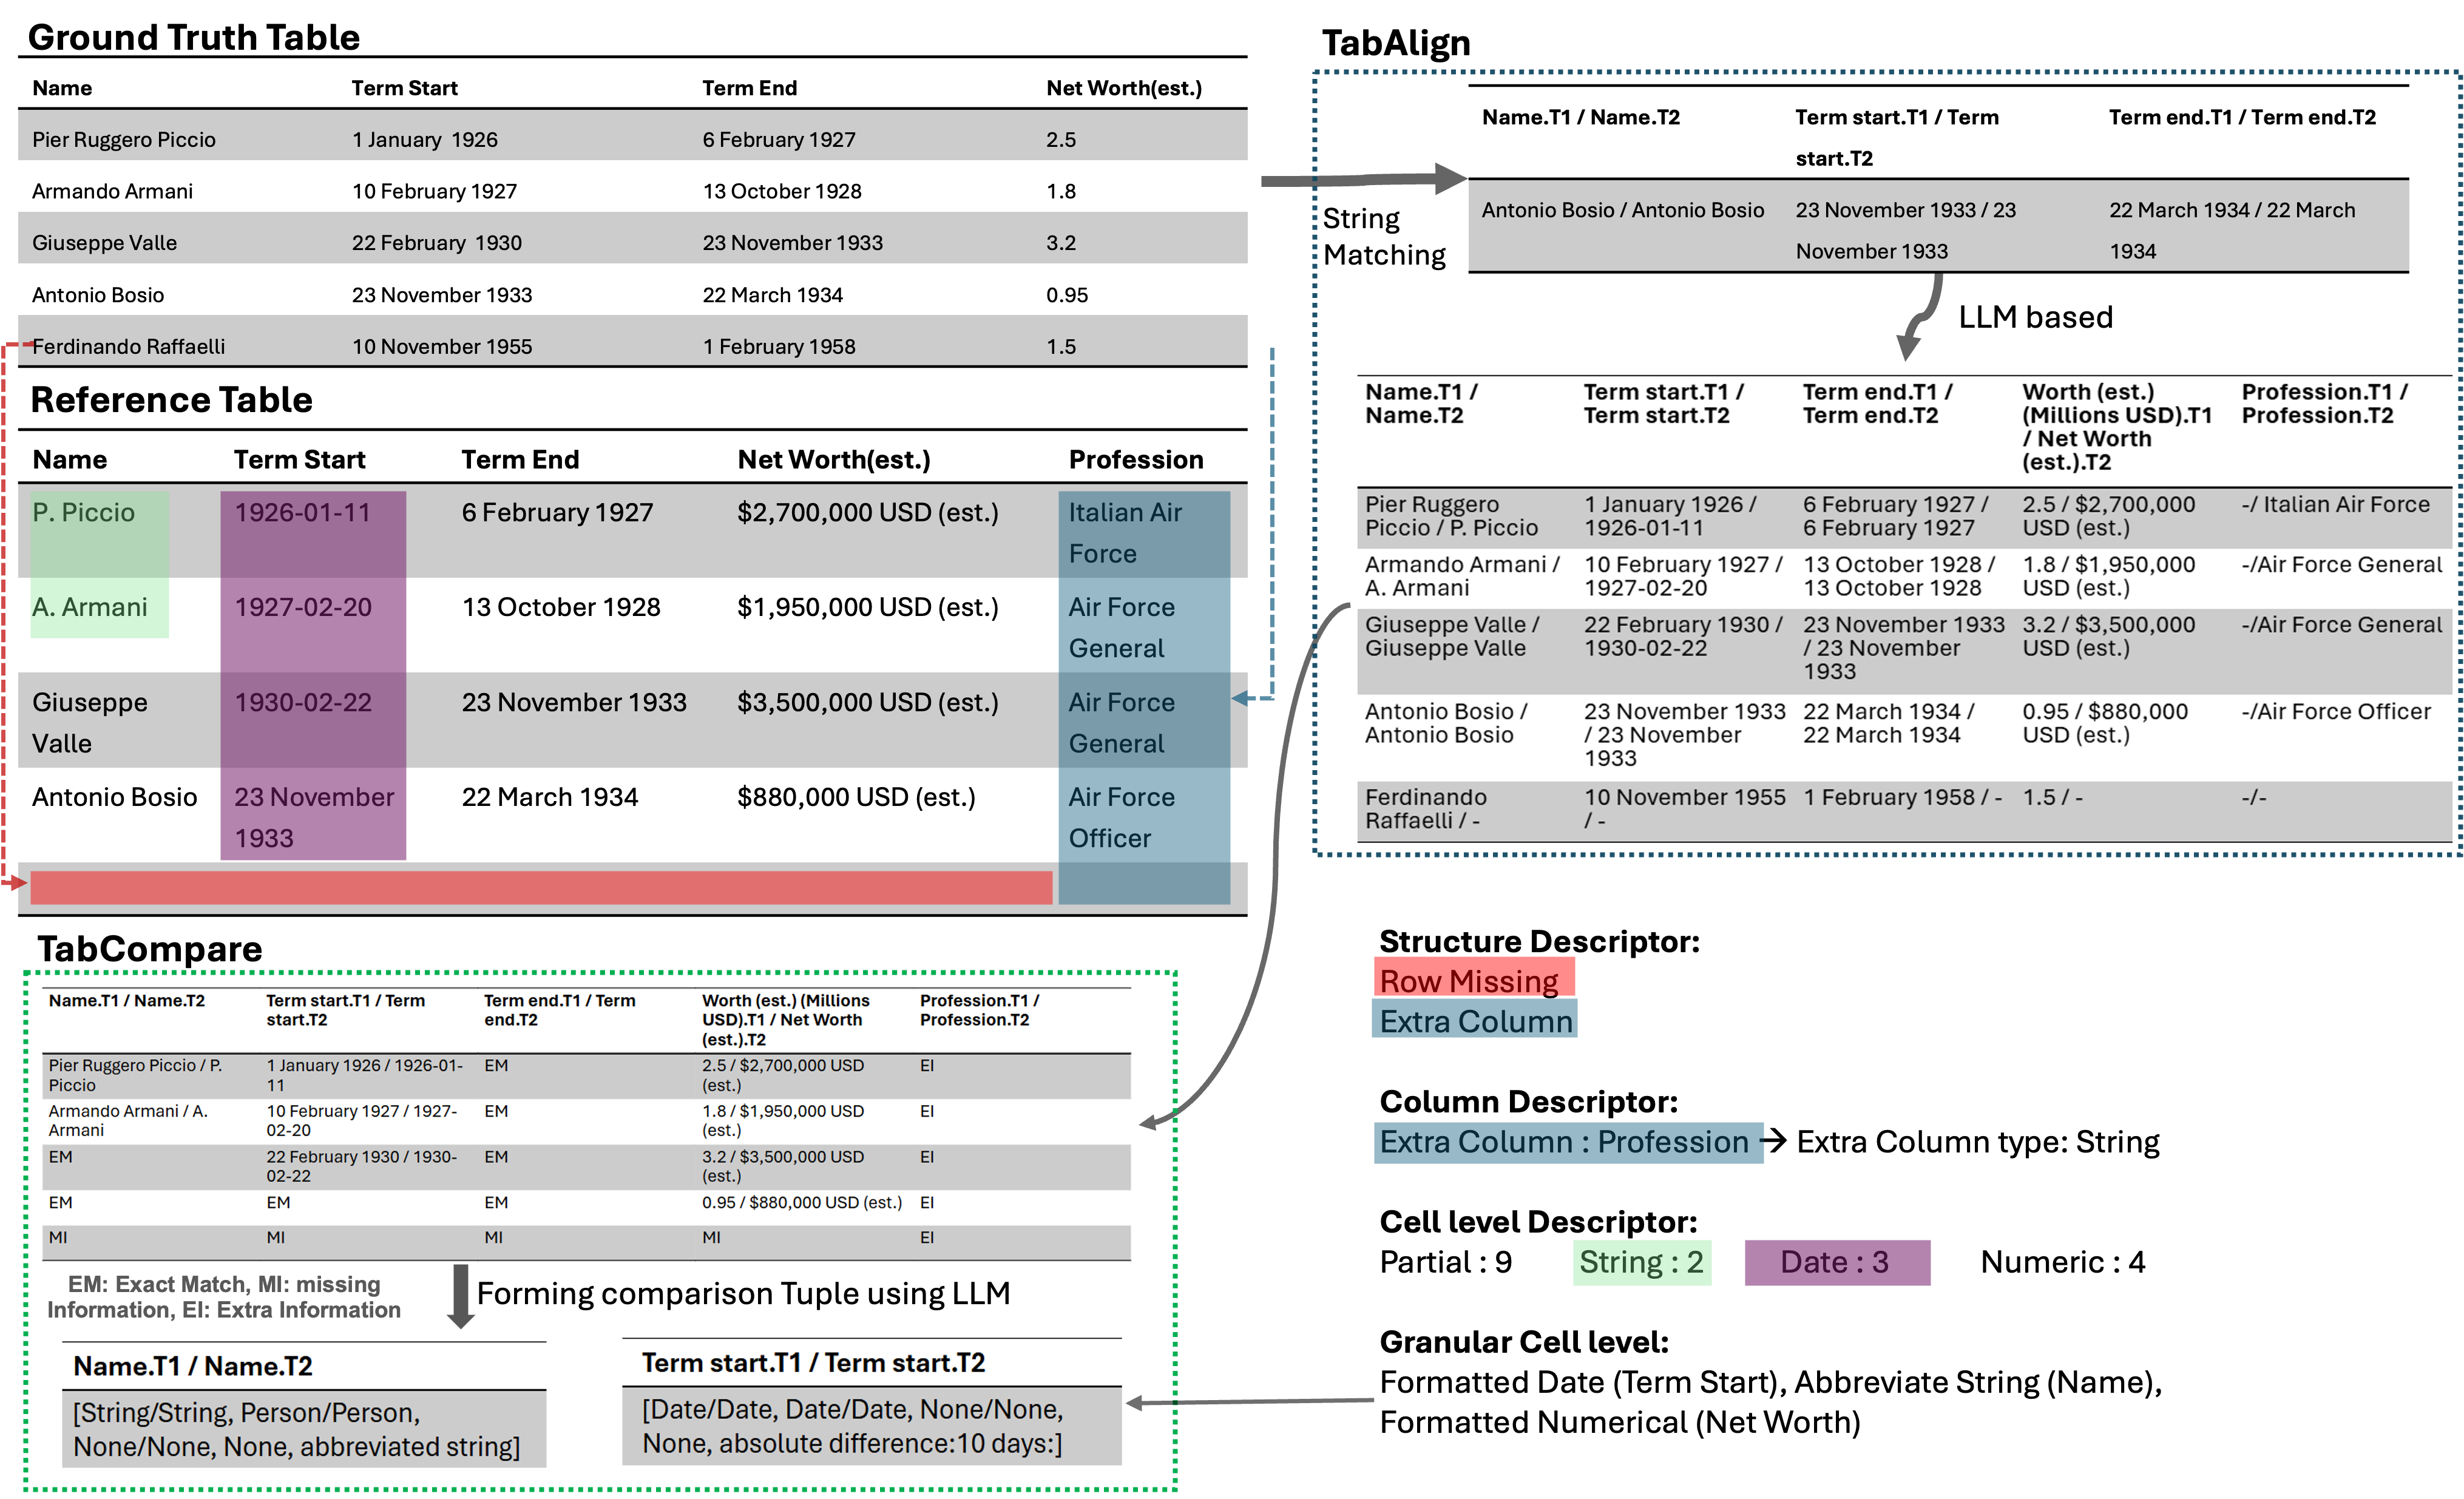
TabXEval aligns tables structurally first, then compares them semantically and syntactically for explainable evaluation.

TabXBench: A benchmark for realistic table evaluation

TabXBench provides a controlled way to study how automatic metrics behave under realistic table perturbations. It supports broad, multi-domain evaluation with human-annotated judgments and enables sensitivity-specificity analysis across a diverse set of failures.

TabXBench overview

Benchmark composition and perturbation design for robust evaluation across table tasks and domains.

How well does TabXEval align with human judgment?

Best Overall Spearman 0.44

Highest rank correlation with human judgments in the comparison set.

Strong Agreement Kendall 0.40

Better ordinal agreement than conventional automatic baselines.

Explainable Scoring RBO 0.34

Competitive overlap with human ranking while retaining interpretable error analysis.

Correlation with Human Judgments

Metric Spearman's ρ ↑ Kendall's τ ↑ W-Kendall's τ† ↑ RBO ↑ Spearman's Footrule ↓
EM0.180.160.160.260.57
chrF0.120.110.080.250.59
H-Score0.140.110.090.280.51
BERTScore0.190.150.130.250.57
ROUGE-L0.210.180.400.270.53
BLEURT0.290.250.250.270.51
TabEval-0.04-0.04-0.030.230.63
P-Score0.300.270.240.310.39
LLM rubric0.230.160.170.280.47
LLM ranking0.290.240.230.300.41
Multi-prompt0.290.240.230.300.42
Multi-prompt + CoT0.300.250.240.290.45
TabXEval0.440.400.380.340.29