InterChart is a diagnostic benchmark for assessing how well vision-language models reason across multiple related charts a core skill for scientific reports, finance, and public dashboards. Unlike prior single-chart benchmarks, InterChart covers diverse question types from entity inference and trend correlation to numerical estimation and abstract multi-step reasoning grounded 
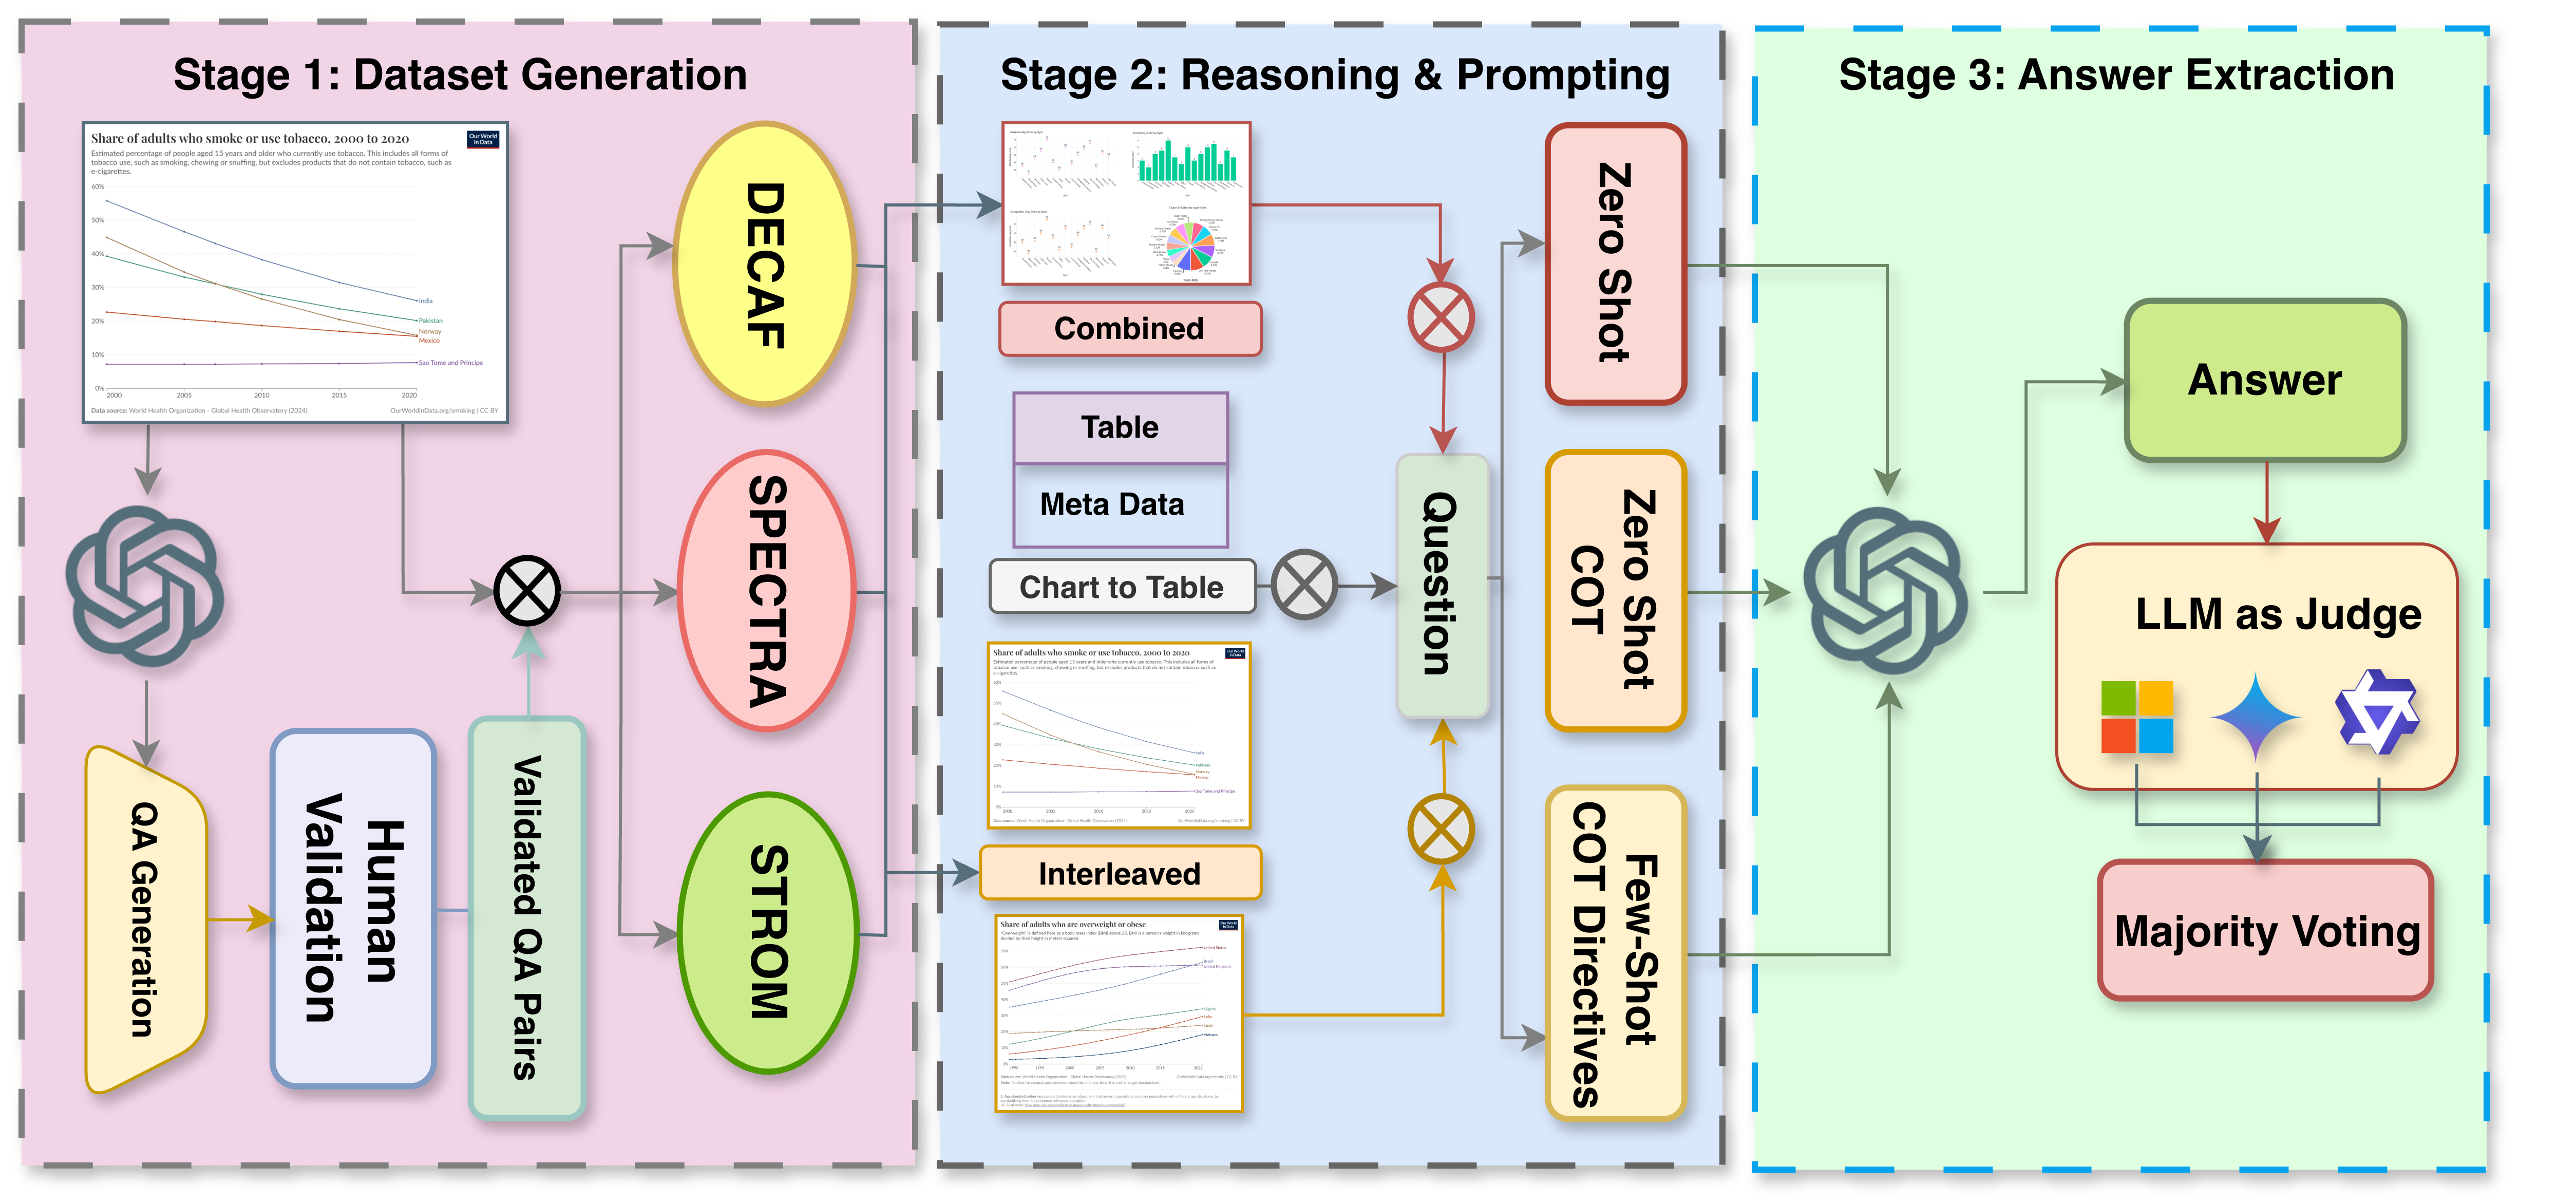
in 2–3 thematically or structurally related charts. We organize the benchmark into three tiers of increasing difficulty: (1) factual reasoning over individual charts, (2) integrative analysis across synthetically aligned chart sets, and (3) semantic inference over visually complex, real-world chart pairs.
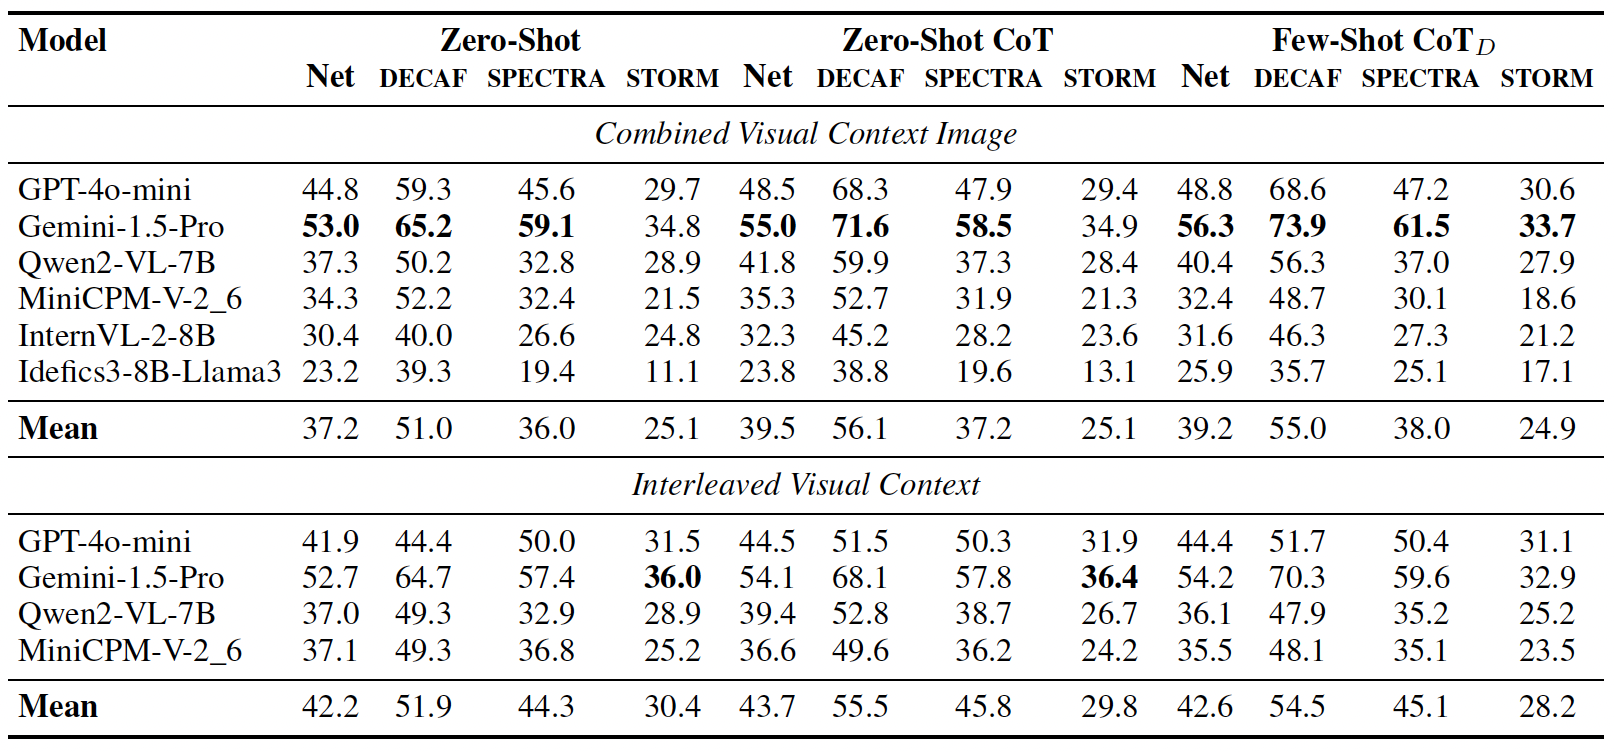
Evaluations on state-of-the-art open- and closed-source VLMs reveal consistent accuracy drops as 
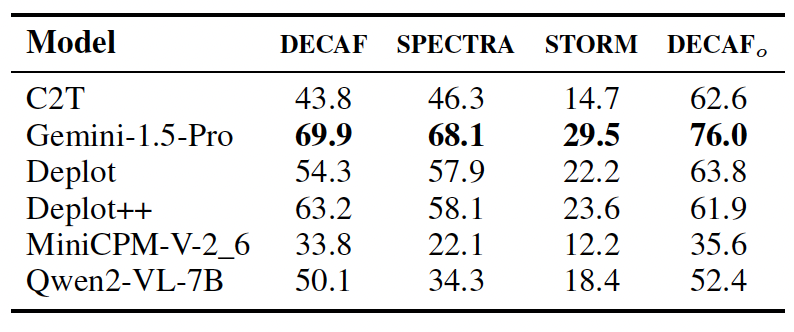
visual complexity rises, while chart decomposition improves performance highlighting current limitations in cross-chart integration. Overall, InterChart provides a rigorous framework for advancing multimodal reasoning in complex, multi-visual settings.
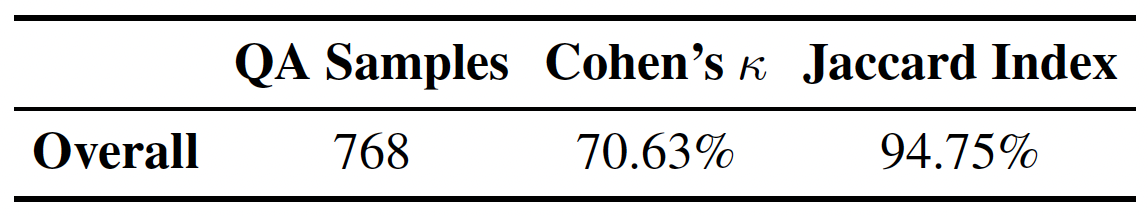
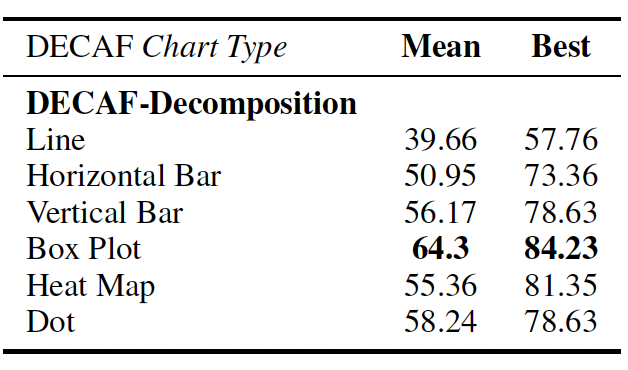
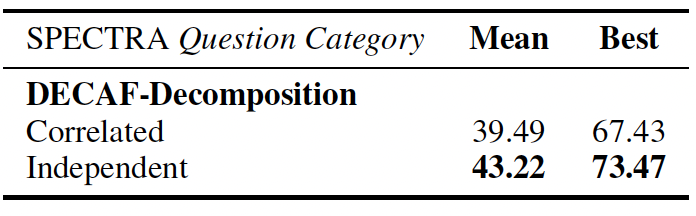
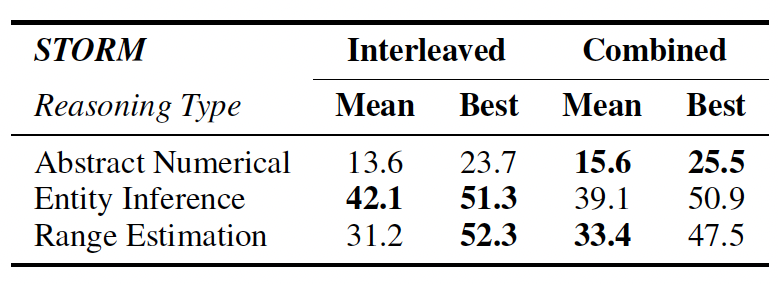
Dataset scope (high level): 5,214 validated QA pairs spanning three subsets DECAF, SPECTRA, and STORM across 1,012 multi-chart contexts and 2,706 unique chart images.
InterChart introduces a structured benchmark spanning three levels of complexity: DECAF, SPECTRA, and STORM. Together, these subsets evaluate how vision-language models handle factual lookups, cross-chart integration, and semantic inference under realistic conditions.
The summary tables below outline dataset composition. The first table (left) reports DECAF distributions: chart types, original source datasets, and totals from the QA generation pipeline. The second table (right) gives SPECTRA and STORM splits and overall totals. Together, they describe the breadth of chart genres and reasoning settings covered in InterChart.
Table 1: DECAF distributions and totals.
Table 2: SPECTRA & STORM distributions and totals.
We apply human verification to filter automatically generated questions and answers, retaining only high-quality items. The QA samples table (left) shows pre- and post-verification counts with percentage drop. Inter-annotator agreement (right) is reported for STORM using Cohen’s κ and Jaccard Index. See the appendix for guidelines, prompts, and adjudication details.
Table 3: QA samples before/after verification (DECAF & SPECTRA).
Table 4: STORM annotation agreement (Cohen’s κ, Jaccard).
The InterChart evaluation pipeline assesses how vision-language models (VLMs) understand and reason across multi-chart visual contexts. The process operates in three stages: Dataset Generation - creating diverse question–answer pairs through LLM-assisted synthesis and human validation for the three subsets (DECAF, SPECTRA, and STORM); Reasoning and Prompting - feeding charts and their metadata into models using different input formats (Combined or Interleaved) and prompting strategies such as zero-shot, zero-shot-CoT, and few-shot CoT with directives; and Answer Evaluation - aggregating responses using multiple LLM-based semantic judges (Gemini, Phi, and Qwen) through majority voting to ensure consistent, robust scoring.
This multi-judge evaluation design moves beyond exact string matching and accounts for semantic equivalence, numeric tolerance, and reasoning correctness. It provides a transparent framework for analyzing both local and cross-chart reasoning failures, setting a foundation for future multimodal diagnostic benchmarks.
Overview of the InterChart Benchmark Pipeline.
We evaluate models on InterChart with an LLM-as-judge, using majority voting across evaluators. Scores are grouped by visual context (Combined vs. Interleaved) and prompting strategy (Zero-Shot, Zero-Shot CoT, Few-Shot CoTD). “Net” is the mean over subsets.
The grid below summarizes specific analyses: chart-to-table prompting & rendering (Table 6), distributional breakdowns for DECAF (Table 7) and SPECTRA (Table 8), and STORM reasoning types across visual formats (Table 9).
Table 6. Chart-to-table prompting & rendering for DECAF, SPECTRA, STORM, and DECAFo.
Table 7. DECAF by chart type (Mean / Best).
Table 8. SPECTRA question categories (Correlated vs. Independent; Mean / Best).
Table 9. STORM reasoning types (Abstract Numerical, Entity Inference, Range Estimation) under Interleaved vs. Combined formats (Mean / Best).
@inproceedings{iyengar2025interchart,
title={InterChart: Benchmarking Visual Reasoning Across Decomposed and Distributed Chart Information},
author={Iyengar, Anirudh Iyengar Kaniyar Narayana and Mukhopadhyay, Srija and Qidwai, Adnan and Singh, Shubhankar and Roth, Dan and Gupta, Vivek},
journal={arXiv preprint arXiv:2508.07630},
year={2025}
}