TabReX:

Tabular Referenceless eXplainable Evaluation

Accepted to ACL Mains 2026 🎉
Arizona State University, Adobe Research

A referenceless, graph-grounded metric for evaluating generated tables with interpretable error traces and robust human alignment.

Why It Matters

Referenceless table evaluation

TabReX scores generated tables directly against source text, avoiding brittle one-reference matching.

How It Works

Graph reasoning with traces

It canonicalizes text and tables into KGs, aligns them, and exposes cell- and table-level error evidence.

What We Built

A benchmark for stress-testing metrics

TabReX-Bench spans 9,120 perturbed tables across 6 domains and 3 difficulty tiers.

Highlights

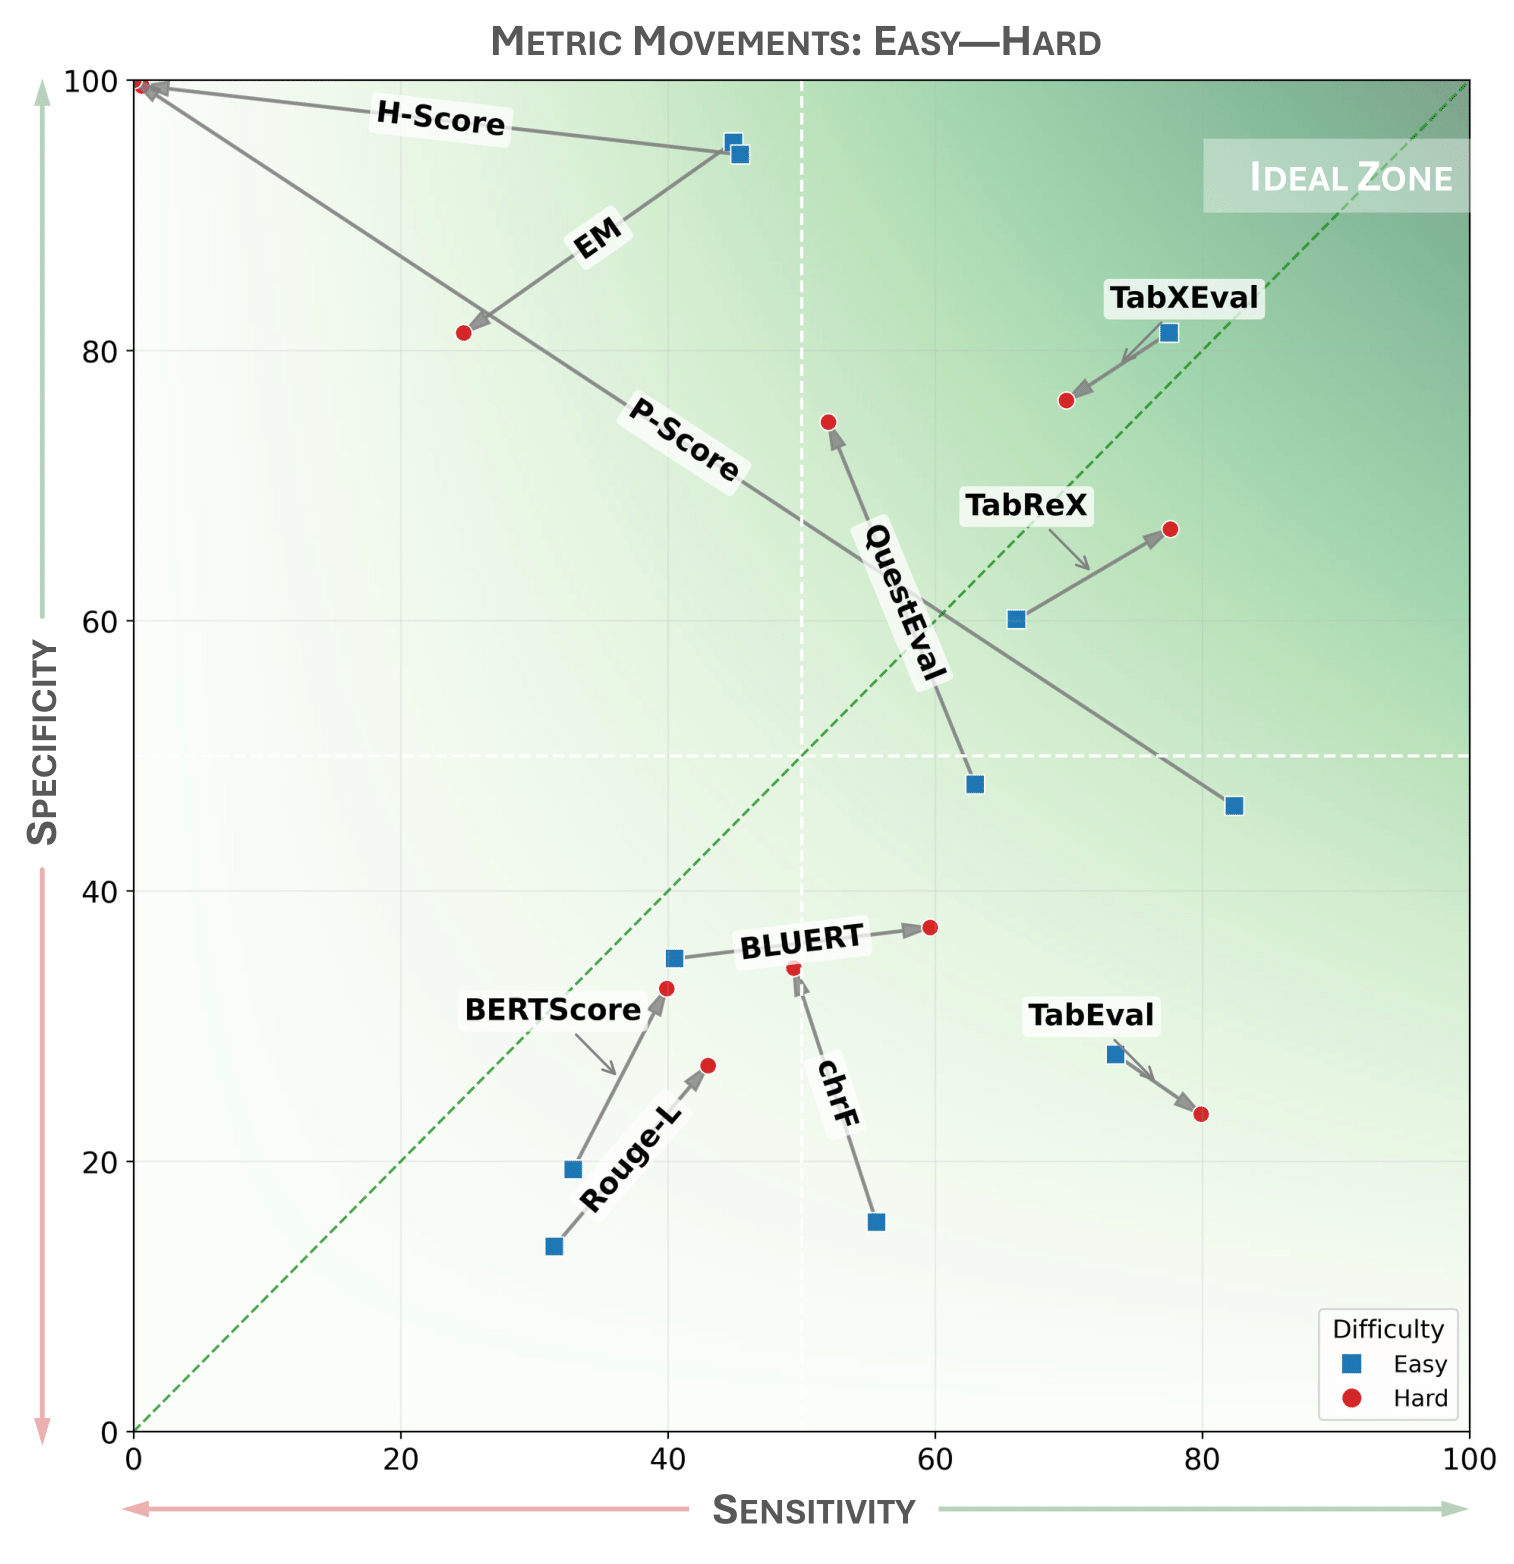
  • Human alignment: TabReX reaches ρS = 74.51 and τK = 64.24 on TabReX-Bench, outperforming other referenceless baselines.
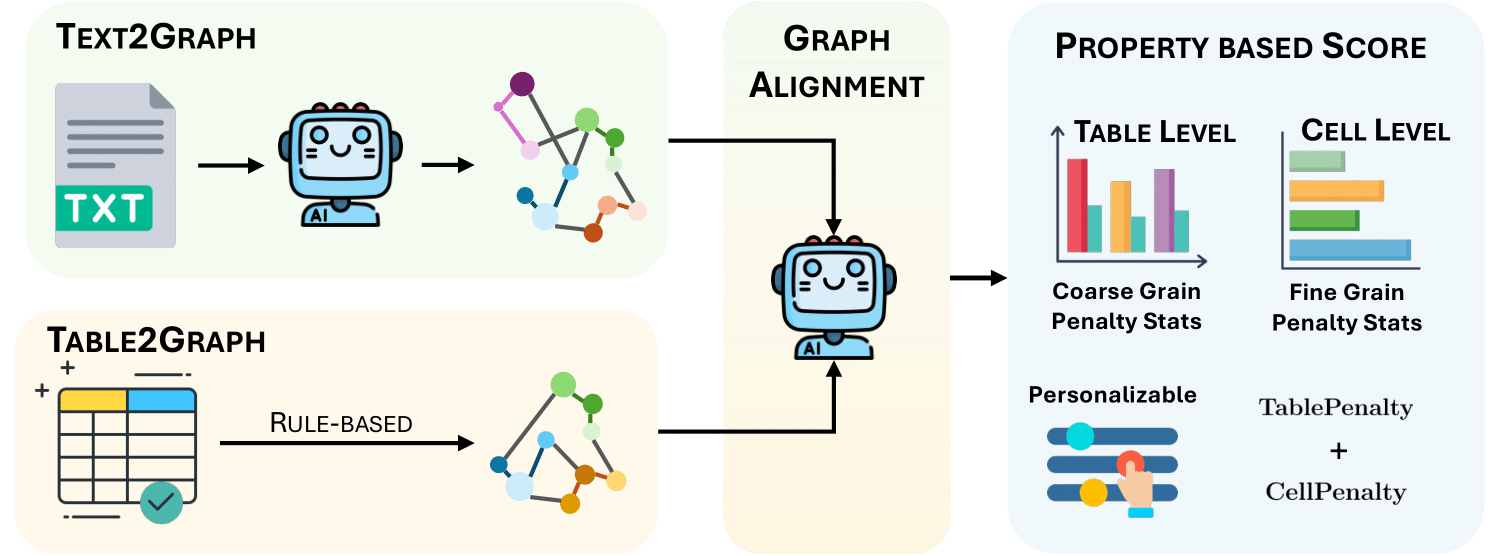
  • Interpretability: The metric returns explicit cell- and table-level traces instead of a single opaque score.
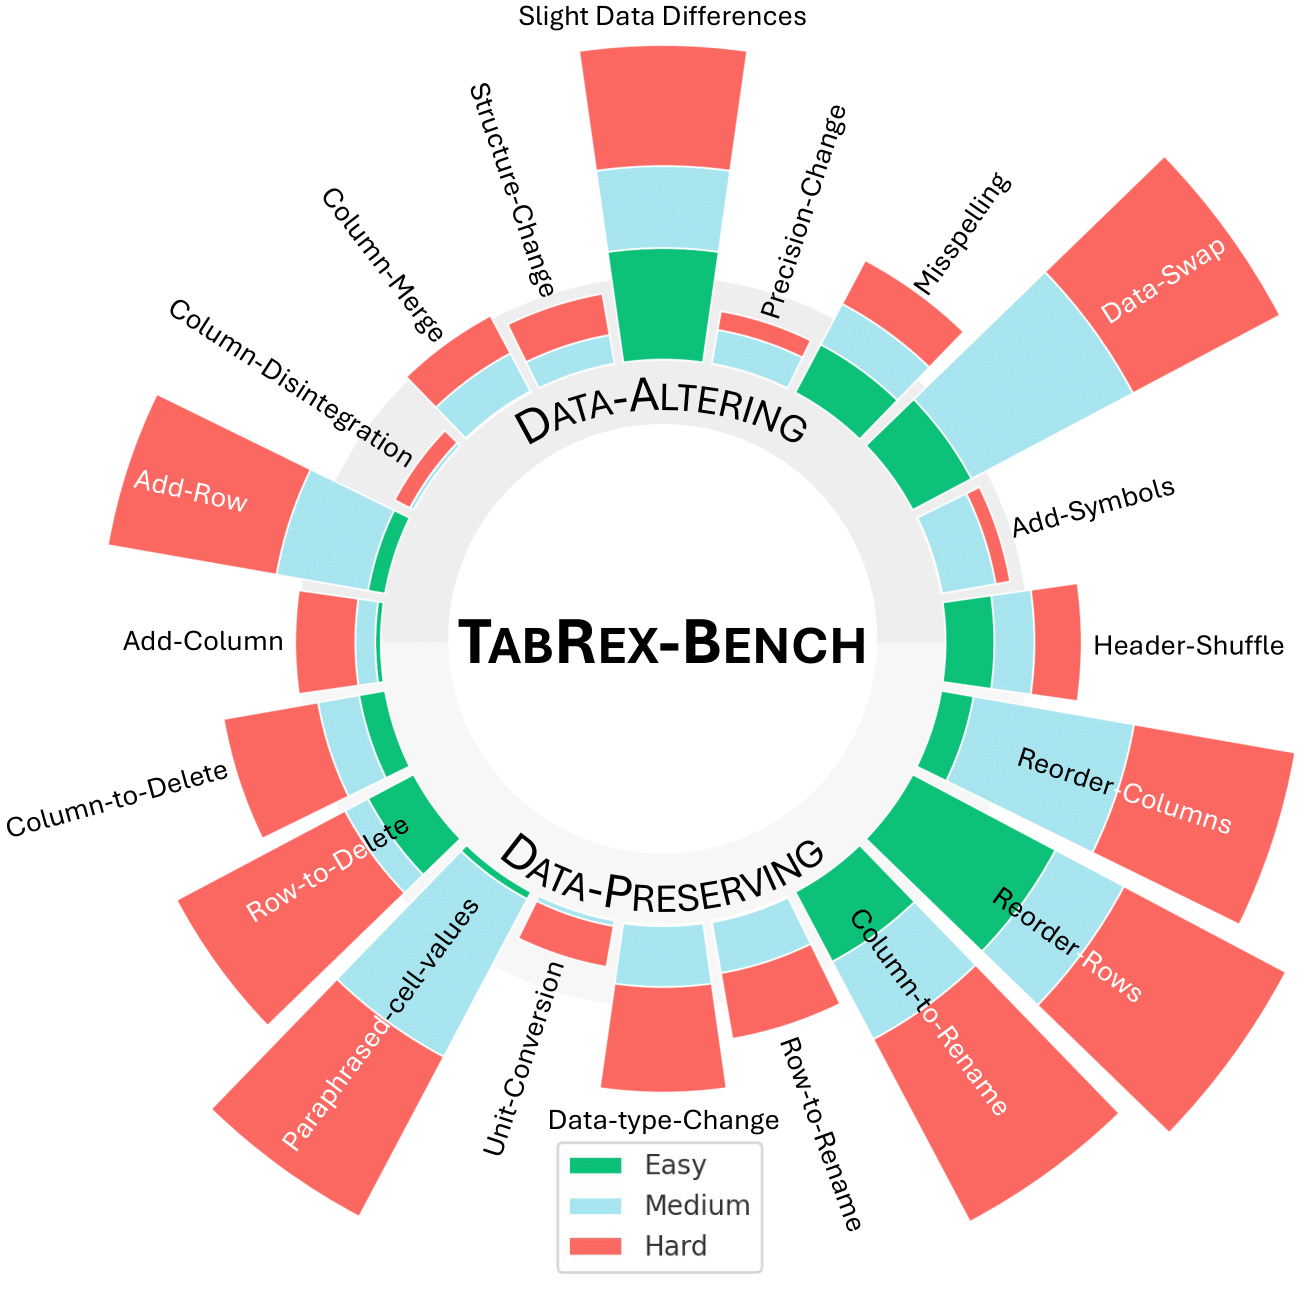
  • Robustness: The benchmark probes schema edits, entity swaps, numeric errors, and harder perturbation tiers.
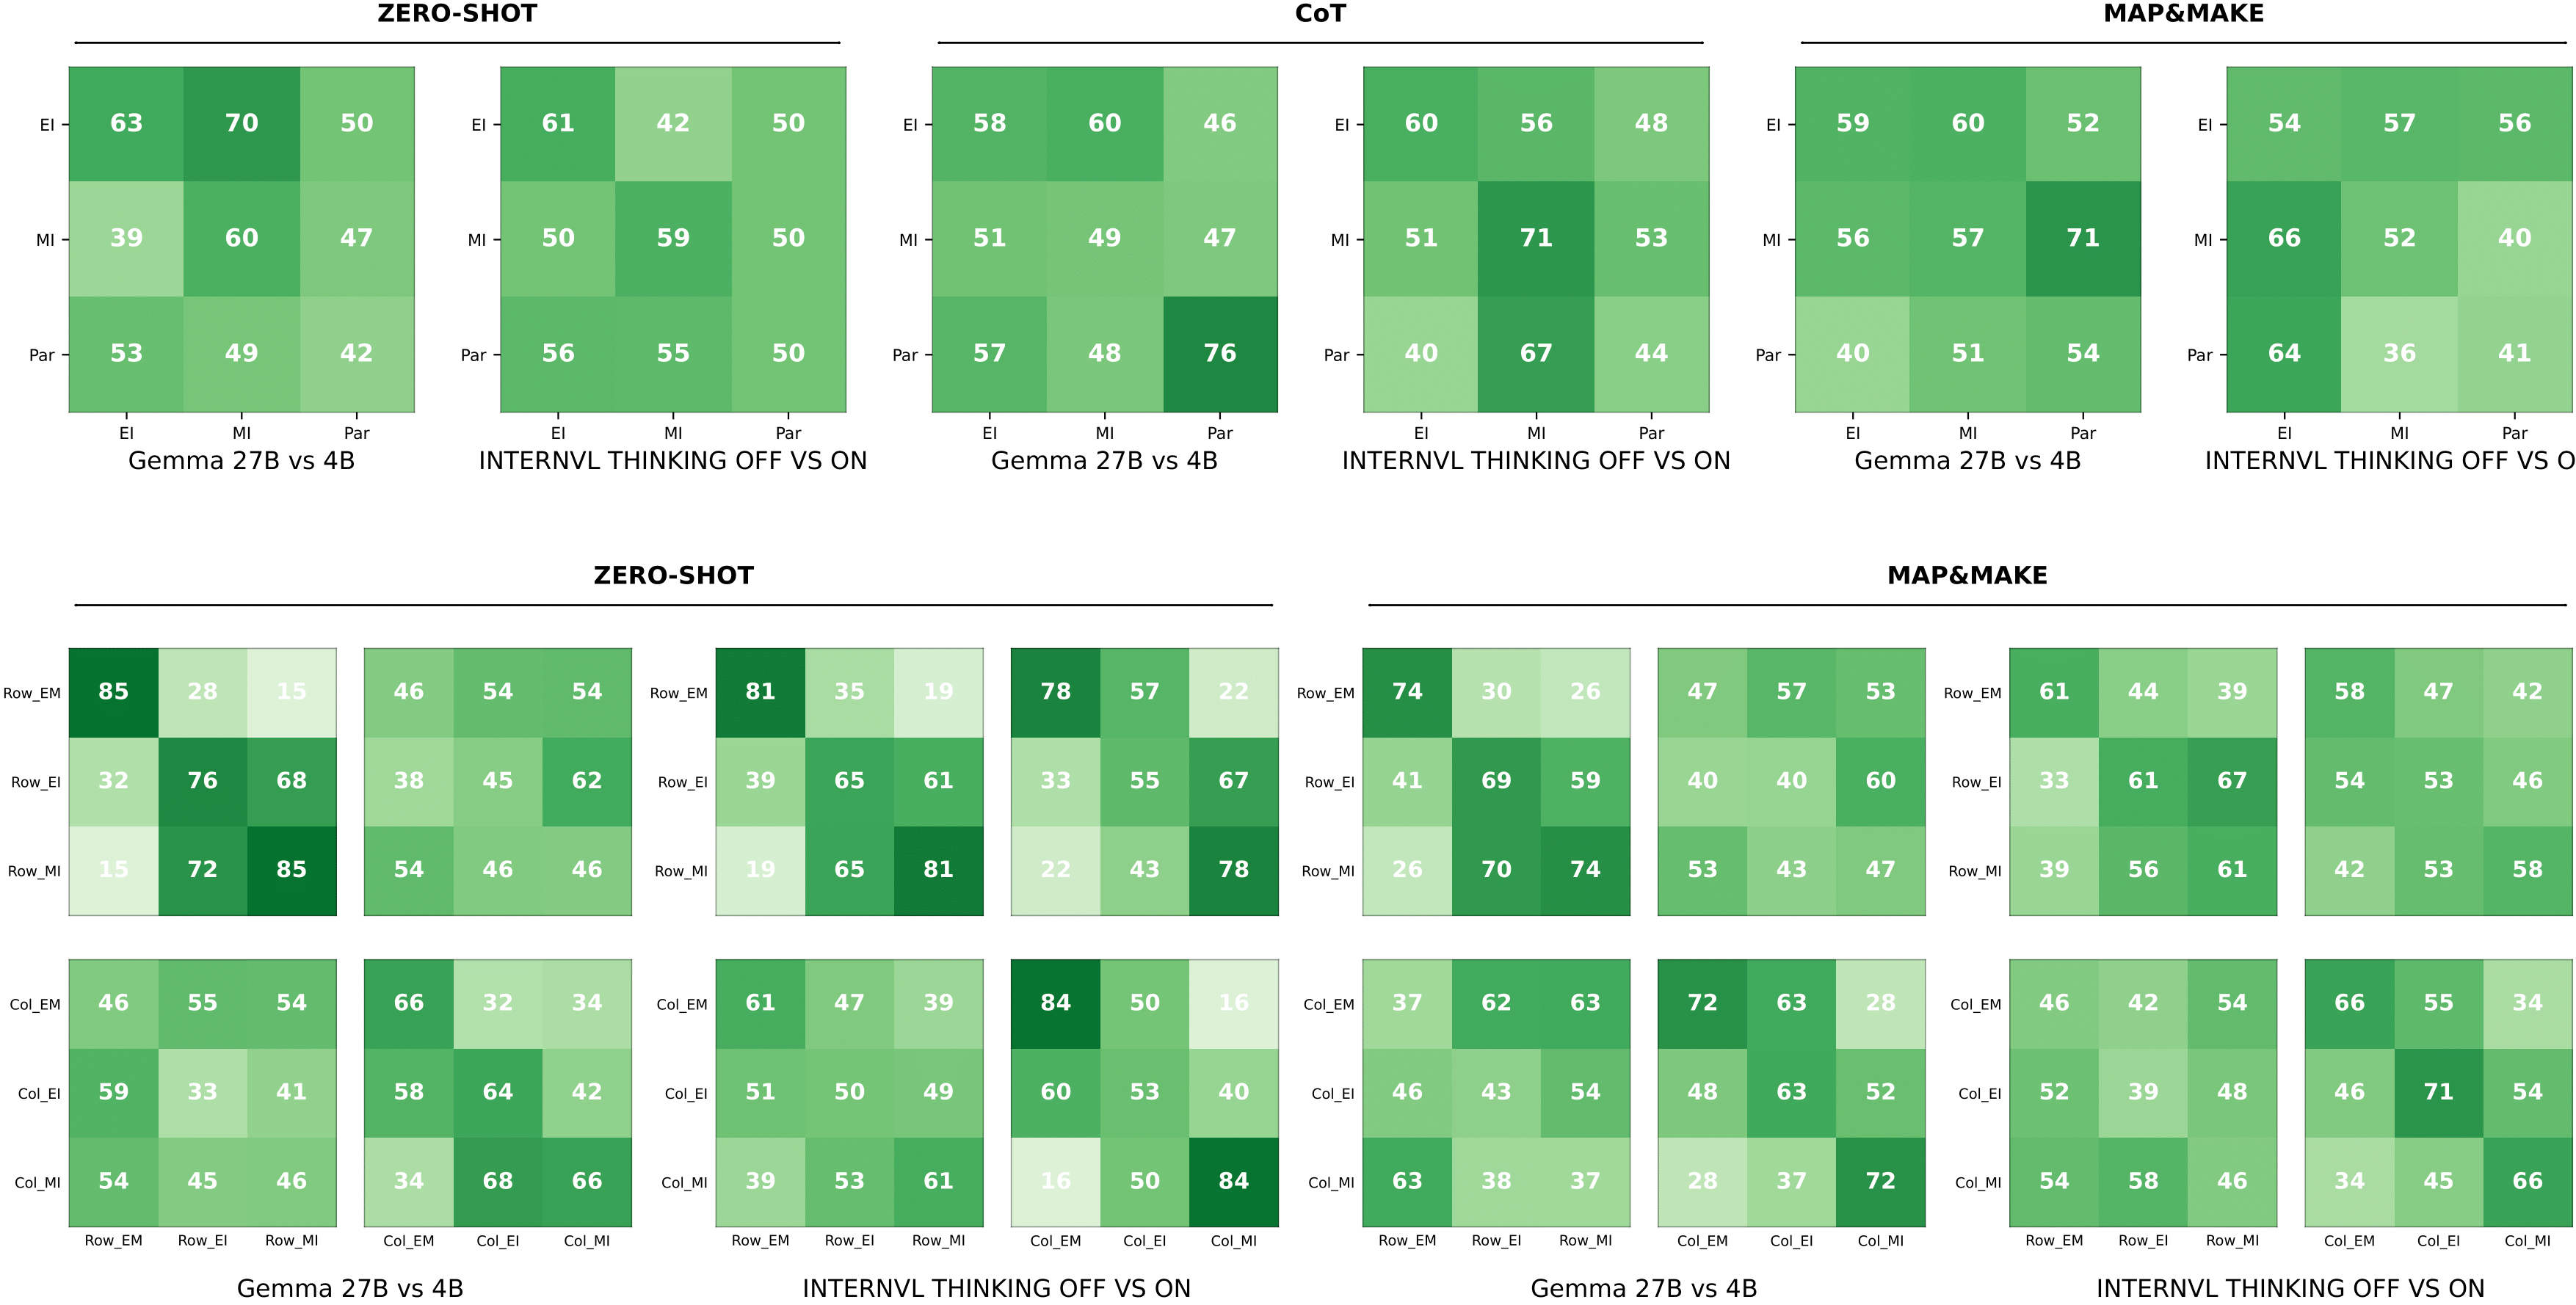
  • Actionable analysis: TabReX supports model and prompt comparisons with a tunable sensitivity-specificity trade-off.
9,120 Benchmark Tables
6 Domains
12 Perturbation Types
3 Difficulty Tiers

System Overview

From source text to scored tables

TabReX turns table evaluation into a structured reasoning problem instead of surface-form matching.

  • Canonicalization: Convert source text and generated tables into comparable KG structures.
  • Alignment: Use LLM-guided matching to connect entities, headers, and values across views.
  • Rubric-aware scoring: Produce interpretable structure and factuality scores with traceable failures.
TabReX pipeline overview

Canonical KG conversion, LLM-guided alignment, and rubric-based scoring together yield explainable evaluation traces.

Why is Evaluating Generated Tables Hard?

Evaluating tables generated by large language models is hard: text-only metrics (like ROUGE, BERTScore) miss the critical structural information of a table.

On the other hand, reference-based metrics (like Exact Match) are too rigid. They fail to generalize across different tasks or schemas, penalizing tables that are factually correct but structured differently from a single "gold" reference.

We need a metric that is referenceless, understands tabular structure, and is interpretable.

How TabReX Works: Evaluation as Graph Reasoning

TabReX approaches evaluation as graph reasoning. Instead of comparing to a reference table, we compare the generated table directly against the source text.

We convert the source text and generated table into canonical KGs, align them with an LLM‑guided matcher, and score them with rubric rules for structure and factual fidelity. The result is interpretable scores, a tunable sensitivity–specificity trade‑off, and cell‑ or table‑level error traces for diagnosis.

Step 01

Canonicalize

Convert source text and generated tables into aligned KG views so structure and semantics can be compared consistently.

Step 02

Align

Use LLM-guided matching to resolve entity, row, column, and value correspondences across the two graph representations.

Step 03

Score and Trace

Apply rubric rules to produce structure and fidelity scores, then surface explicit cell- and table-level failures for diagnosis.

Finding Errors: What TabReX Sees

TabReX produces cell-level, table-level error traces that reveal where and why a generated table deviates from the source. These traces arise directly from graph alignment conflicts and rubric checks, helping users diagnose specific issues.

We convert both the Source Text (g1) and the Generated Table (g2) into Knowledge Graphs, then align them to find mismatches. The graph triplets are in [Row Header, Column Header, Cell Value] format.

Example 1

Schema Mismatch

Source & Table Graphize Align Trace

How Can We Reliably Test a Metric?

TabReX‑Bench stress‑tests metric robustness and generalization. It spans multiple domains and planner‑driven perturbations across three difficulty tiers, enabling controlled, harder‑case analyses.

Domains

6

Perturbation Types

12

Difficulty Tiers

3

We define two complementary perturbation groups: Data‑Preserving (Group 0) alters layout or presentation (e.g., row/header reordering, unit conversion, paraphrasing) without changing factual content; Data‑Altering (Group 1) introduces semantic modifications such as adding or deleting rows/columns, swapping numeric values, or injecting noise and misspellings. Each group is further stratified into three difficulty tiers (Easy, Medium, Hard), supporting controlled analyses of metric robustness as perturbation severity increases.

Benchmark Composition by Dataset

Dataset # of Tables # Perturb / Table Total Tables Avg Row Avg Col Avg Cell Avg Tokens Avg Num
FinQA 150 12 1950 5.55 2.47 13.22 119.5 33.55
HiTabQA 150 12 1950 20.08 5.60 115.1 434.8 102.7
ToTTo 150 12 1950 24.97 5.49 142.2 361.3 69.63
OpenML med 10 12 120 4.20 11.58 47.94 210.9 23.80
MIMIC-IV 100 12 1200 10.58 3.94 40.84 153.5 26.29
RotoWire 150 12 1950 10.18 5.86 59.50 146.5 14.33
Total 710 - 9120 - - - - -
TabReX‑Bench composition and protocol

Benchmark overview — domains, perturbations, and difficulty tiers for robust evaluation.

How Well Does TabReX Perform?

TabReX-Bench ρS 74.51

Strongest referenceless alignment with expert ranking on the benchmark.

TabReX-Bench τK 64.24

Improved ordinal agreement while preserving fine-grained rank distinctions.

Real-world Text-to-Table RBO 0.41

Best overlap with expert orderings beyond the controlled benchmark.

Alignment with Human Judgment on TabReX‑Bench

TabReX outperforms all traditional and referenceless LLM‑based metrics in aligning with expert rankings on TabReX‑Bench.

Metric ρS τK τw RBO ↑ ζF πt
Non-LLM Based (w/ Ref)
EM45.8839.3839.5143.3347.4958.40
chrF41.7634.5531.6139.3949.2601.64
ROUGE-L31.1826.6922.5637.6555.9401.97
BLUERT44.6637.6436.0939.5748.0900.77
BERTScore36.2130.6627.9638.1153.2500.92
H-Score56.8747.9751.7341.1140.0200.99
LLM-Based (w/ Ref)
P-Score49.2440.0037.4340.7343.9307.39
TabEval49.0139.2234.2141.1143.0600.63
TabXEval80.2772.3766.8747.5420.9445.33
(w/o Ref)
QuestEval62.9352.2951.7142.7035.0403.03
TabReX (Ours)74.5164.2462.2844.8527.0113.59

Higher values of Spearman’s rank correlation (ρS), Kendall’s tau (τK), weighted Kendall’s tau (τw), and Rank‑Biased Overlap (RBO) indicate stronger monotonic and positional agreement with human orderings (↑), while lower values of Spearman’s footrule distance (ζF) and tie ratio (πt) denote better rank stability and finer discriminative resolution (↓).

Do Ensembles Close the Gap?

Ensembles help but don’t close the gap. The best variant (LLM, harmonic) reaches ρS=0.56 and τK=0.47, still behind TabReX (ρS=0.75, τK=0.64) and with higher rank dispersion—simple averaging or harmonic averaging can’t match TabReX’s targeted, referenceless graph reasoning.

Metric ρS τK τw RBO ↑ ζF πt
Ensemble Baselines
Lex‑Emb (M)38.4332.6530.1738.5252.1500.49
Lex‑Emb (H)29.8024.0019.6837.6555.0400.63
LLM (M)48.4939.2136.9440.5644.3800.42
LLM (H)56.0046.9350.6440.9540.6300.42
Hybrid (M)32.0424.9420.2937.0351.5101.13
Hybrid (H)54.0342.7132.6142.3140.1101.13
TabReX (Ours)74.5164.2462.2844.8527.0113.59

Ensembles combine metric families using either simple Mean (M) or Harmonic (H) aggregation:

  • Lex‑Emb (lexical + embedding): EM, ROUGE‑L, BERTScore, BLEURT, chrF
  • LLM (LLM‑based): P‑Score, H‑Score
  • Hybrid (reference‑based + referenceless): TabXEval, QuestEval

All ensemble variants fall short of TabReX, which achieves the highest correlation with expert rankings and better rank stability.

Correlation on Real-World Text-to-Table Generation

Beyond TabReX‑Bench, we measure correlation with expert rankings on a real‑world text‑to‑table dataset. TabReX again achieves the highest alignment across correlation metrics, outperforming reference‑based and referenceless baselines.

Metric ρS τK RBO ↑
Standard Metrics (w/ Ref)
EM-0.010.010.33
ROUGE-L0.330.250.29
BERTScore0.260.190.38
BLEURT0.290.200.39
CHRF0.250.190.36
LLM-Based (w/ Ref)
TabEval0.250.190.36
TabXEval0.240.170.37
(w/o Ref)
QuestEval0.280.200.39
TabReX (Ours) 0.39 0.30 0.41

Sensitivity–Specificity Under Stress

A robust evaluation metric must remain reliable not only in standard (easy) settings but also under hard perturbations—tables with subtle misalignments, semantic shifts, or fine-grained numeric errors. We use TabReX-Bench to sample both easy and hard cases and compute true-positive (sensitivity) and true-negative (specificity) rates.

Sensitivity vs specificity trade-off

Metric Movements Across Difficulty Levels: Arrows show each metric’s shift from easy (blue) to hard (red) perturbations. The green region denotes the balanced ideal zone, and the dashed diagonal marks the optimal trade-off. TabReX stays near this zone, maintaining the right direction even for hard examples.

Model and Prompt Analysis

TabReX's rubric-aware scoring enables coarse to fine-grained comparisons across models (e.g., Gemma 27B vs. 4B) and prompting strategies (e.g., Zero-Shot, Chain-of-Thought, Map&Make), measured at both cell-level and table-level granularity.

Model-vs-prompt alignment analysis

Rubric-wise alignment across models and prompting strategies: The top row shows cell-level agreement, while the bottom row shows table-level agreement.

Key Insights:

  1. Model Size: Larger models (Gemma 27B) show clear gains in local, fine-grained (cell-level) fidelity but not necessarily global (table-level) coherence.
  2. Reasoning Style: Reasoning-oriented ("Thinking") variants improve precision on numeric/structural dimensions but can reduce semantic coverage, favoring accuracy over breadth.
  3. Prompt Design: The prompt strategy (especially Map&Make) contributes as much as model scale to achieving a balanced alignment across all rubric dimensions.

These results illustrate how a referenceless, explainable evaluation metric like TabReX can reveal the strengths and weaknesses of models and prompting strategies across hierarchical levels.

Top

BibTeX

@misc{anvekar2025tabrextabularreferenceless,
  title={TabReX : Tabular Referenceless eXplainable Evaluation},
  author={Tejas Anvekar and Junha Park and Aparna Garimella and Vivek Gupta},
  year={2025},
  eprint={2512.15907},
  archivePrefix={arXiv},
  primaryClass={cs.CL},
  url={https://arxiv.org/abs/2512.15907},
}